
In today’s digital world, understanding network traffic is crucial for maintaining secure and efficient systems. Whether you’re troubleshooting connectivity issues or safeguarding against cyber threats, analyzing packets provides invaluable insights. That’s where Wireshark comes in—a trusted tool for IT professionals and cybersecurity teams.
Wireshark is the industry-standard network protocol analyzer. It allows you to dive deep into data flows, identify anomalies, and resolve issues with precision. This guide is designed to help you master its features, from installation to advanced techniques, in a practical, step-by-step manner.
By the end of this guide, you’ll have the skills to confidently analyze network traffic and enhance your system’s performance and security. Let’s get started!
Key Takeaways
- Wireshark is the go-to tool for network protocol analysis.
- Packet analysis is essential for troubleshooting and security.
- This guide covers installation to advanced features.
- Ideal for IT professionals and cybersecurity teams.
- Practical, step-by-step approach for all skill levels.
What is Wireshark and Why is it Essential?
Wireshark stands as a cornerstone in network diagnostics. This open-source tool is designed to capture and analyze packets across various connection types, including Ethernet, Wi-Fi, and Bluetooth. Its versatility makes it indispensable for IT professionals and cybersecurity teams.
Supported by global network specialists, Wireshark is trusted by government agencies, corporations, and educational institutions. Its ability to decode over 3,000 network protocols ensures comprehensive traffic analysis. Whether you’re troubleshooting connectivity issues or conducting security audits, Wireshark delivers precise insights.
Understanding Wireshark’s Role in Network Analysis
Wireshark excels in real-time packet capture, allowing users to monitor traffic as it flows through the network. This capability is crucial for identifying anomalies, diagnosing issues, and ensuring optimal performance. Its intuitive interface makes it accessible to both beginners and experts.
Key Features of Wireshark
Here are some standout features that make Wireshark a go-to tool for network analysis:
- Real-time capture and analysis of packets.
- Support for over 3,000 network protocols.
- Compatibility with multiple connection types, including Ethernet and Wi-Fi.
- Advanced filtering options for targeted analysis.
- Use cases in troubleshooting, education, and security audits.
“Wireshark’s ability to decode and analyze packets in real-time makes it an essential tool for modern network management.”
However, it’s important to note that Wireshark should only be used on networks where you have explicit permission. Ethical and legal considerations are paramount when working with network analysis tools.
When Should You Use Wireshark?
Effective network management often requires precise tools for diagnostics. Wireshark is one such tool, offering detailed insights into network behavior. It’s particularly useful for identifying network issues, debugging protocols, and conducting security analysis.
Common Use Cases for Wireshark
Wireshark excels in several scenarios. Here are some key activities where it proves invaluable:
- Troubleshooting: Detect latency, packet loss, or misconfigurations in your network.
- Protocol Debugging: Analyze specific protocols to ensure they function as intended.
- Security Analysis: Identify suspicious patterns, such as malware or unauthorized access attempts.
For example, during the Norman cryptominer investigation, Wireshark helped uncover malicious network activities by analyzing traffic patterns.
Limitations of Wireshark
While powerful, Wireshark has its constraints. It doesn’t provide real-time alerts, requiring users to manually review captured data. Additionally, effective use demands a solid understanding of protocols and network behavior.
Another limitation is its inability to monitor remote network segments without local access. For comprehensive threat detection, tools like Varonis can complement Wireshark’s capabilities.
How to Download and Install Wireshark
Getting started with Wireshark begins with a seamless installation process. Whether you’re on Windows, Mac, or Linux, setting up this powerful tool is straightforward. Below, we’ll guide you through the steps for each operating system, ensuring you’re ready to capture network traffic in no time.

Installing Wireshark on Windows
For Windows users, Wireshark offers both 32-bit and 64-bit versions. Start by visiting the official website and downloading the appropriate installer. Run the executable file and follow the on-screen instructions. Ensure you select the correct network interface during setup to optimize performance.
Installing Wireshark on Mac
Mac users can install Wireshark using Homebrew, a popular package manager. Open Terminal and enter the command: brew install wireshark. Once installed, verify the setup by launching the application. This method ensures you have the latest version and all necessary dependencies.
Installing Wireshark on Linux
Linux installation varies by distribution. For Ubuntu, use: sudo apt-get install wireshark. Fedora users can run: sudo dnf install wireshark. Kali Linux includes Wireshark by default, but you can update it using: sudo apt-get update && sudo apt-get install wireshark. Always verify the installation to ensure proper functionality.
After installation, take a moment to explore the interface. Familiarize yourself with the layout and settings to make the most of Wireshark’s capabilities. With the tool installed, you’re ready to start analyzing data and enhancing your network’s performance.
Setting Up Wireshark for Packet Capture
Proper setup ensures accurate and efficient packet analysis with Wireshark. Before diving into diagnostics, configuring the tool correctly is essential. This section guides you through selecting the right network interface and optimizing capture settings for precise results.

Choosing the Right Network Interface
Identifying the correct network interface is the first step. Wireshark lists all active interfaces, but selecting the one with the most traffic ensures comprehensive data collection. Look for indicators like packet count and activity levels to make an informed choice.
Enabling promiscuous mode broadens the scope of capture, allowing Wireshark to monitor all packets on the LAN. This mode is particularly useful for troubleshooting or security audits. However, ensure you have permission to monitor the network before activating it.
Configuring Capture Settings
Customizing capture settings enhances efficiency. Start by applying filters to exclude irrelevant data. For example, using port 53 excludes DNS traffic, focusing on specific protocols. This reduces clutter and speeds up analysis.
Optimizing buffer size and packet snap length ensures smooth performance during long captures. Adjust these settings based on your system’s capabilities and the expected volume of packets. Additionally, configure auto-stop conditions to prevent overwhelming your storage.
- Identify active interfaces using traffic indicators.
- Activate promiscuous mode for broader LAN monitoring.
- Apply capture filters like host, net, or port.
- Optimize buffer size and packet snap length.
- Set auto-stop conditions for extended captures.
With these configurations in place, you’re ready to start capturing and analyzing network traffic effectively. Proper setup ensures accurate insights and streamlined troubleshooting.
How to Use Wireshark to Analyze Packet Traffic
Mastering network diagnostics requires a deep understanding of data flows and protocols. Wireshark simplifies this process by providing tools to capture and interpret network activity. Let’s explore how to initiate captures and navigate the interface effectively.
Starting and Stopping Packet Capture
Initiating capturing packets is straightforward. You can start using the toolbar button, the menu, or a keyboard shortcut. Each method offers flexibility, allowing you to choose the most convenient option for your workflow.
Real-time analysis begins immediately after starting the capture. This feature is invaluable for identifying issues as they occur. Stopping the capture is equally simple, ensuring you can pause and review data at any time.
Understanding the Wireshark Interface
The interface is divided into three main panes: Packet List, Details, and Bytes. The Packet List pane displays essential information like No., Time, Source, Protocol, and Length. This layout helps you quickly identify key data points.
Customizing column views enhances your analysis. For example, you can add or remove columns to focus on specific details. The right-click context menu also provides options for tracking individual packets, making it easier to follow data flows.
Understanding these components ensures you can navigate the display efficiently. With practice, you’ll be able to interpret captured data with precision and confidence.
Analyzing Captured Packets in Wireshark
Once packets are captured, the next step is to dive into their details for meaningful insights. Wireshark provides a comprehensive interface to explore these packet details, helping you understand network behavior and troubleshoot issues effectively.
Navigating the Packet List Pane
The Packet List Pane is your starting point for analysis. It displays essential information like source, destination, and protocol type. Sorting packets by protocol or source IP simplifies the process of identifying specific data flows.
For example, filtering by TCP helps focus on connection-oriented protocols. This approach is particularly useful when decoding the TCP handshake process, which involves a sequence of SYN, SYN-ACK, and ACK packets.
Interpreting Packet Details
The Details Pane breaks down each packet into its packet details, including the TCP/IP layers. This hierarchical view allows you to examine headers, payloads, and other components. Understanding these layers is crucial for diagnosing issues like misconfigurations or latency.
For instance, examining the IP header reveals source and destination addresses, while the TCP header provides sequence numbers and flags. This information is invaluable for tracking conversations and identifying anomalies.
Using the Packet Bytes Pane
The Bytes Pane offers a hexadecimal and ASCII view of packet data. This feature is essential for manual protocol analysis, especially when dealing with custom or non-standard formats. Converting hex to ASCII can reveal readable text, such as HTTP requests or responses.
For example, analyzing an HTTP packet in hex view can help correlate requests and responses. This method is particularly useful for debugging web applications or identifying suspicious activity.
| Pane | Function | Use Case |
|---|---|---|
| Packet List | Displays packet summaries | Sorting by protocol or IP |
| Details | Breaks down packet layers | Diagnosing TCP/IP issues |
| Bytes | Shows hex and ASCII data | Manual protocol analysis |
“Understanding packet details is the foundation of effective network analysis. Wireshark’s panes provide the tools to decode and interpret data with precision.”
By mastering these panes, you can extract actionable insights from captured packets. Whether you’re troubleshooting or conducting a security audit, Wireshark’s interface ensures you have the information you need to succeed.
Applying Filters in Wireshark
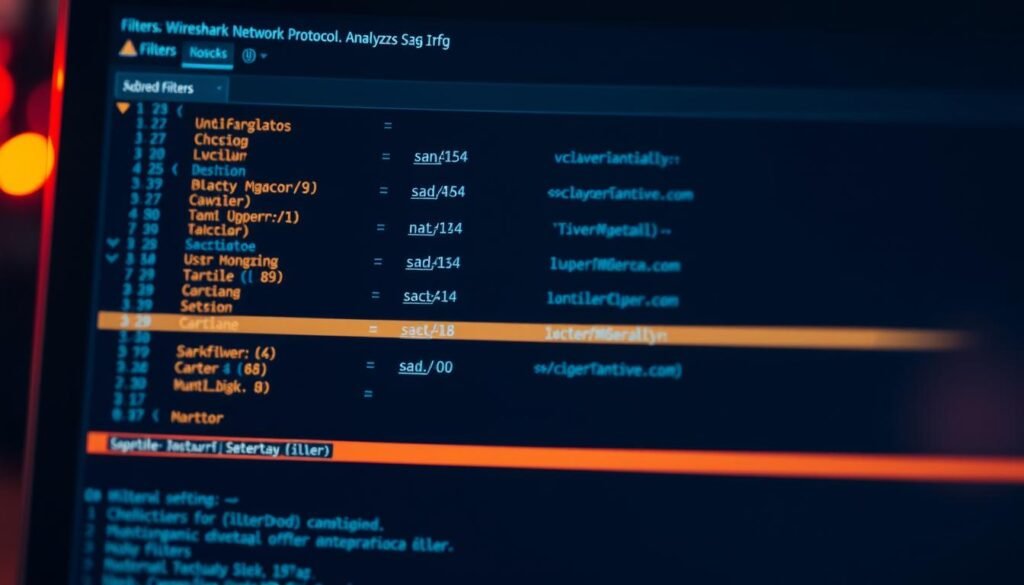
Filters in Wireshark streamline network analysis by focusing on specific data. Whether you’re isolating traffic from a single host or excluding irrelevant protocols, filters enhance precision and efficiency. This section explores the two main types: capture and display filters.
Using Capture Filters
Capture filters narrow down data collection during the initial capture phase. For example, host 192.168.1.1 isolates traffic from a specific IP address. Similarly, port not 53 excludes DNS traffic, reducing clutter in your capture file.
These filters are ideal for scenarios where you know exactly what you’re looking for. They save storage space and processing time by excluding unnecessary data from the start.
Using Display Filters
Display filters refine captured data after the fact. Operators like ==, !=, and contains allow for granular control. For instance, ip.src==192.168.1.1 and tcp.port==80 isolates HTTP traffic from a specific source.
Complex filters can target specific protocols or detect anomalies. For example, creating a filter to identify Sasser worm activity helps in threat detection. Display filters are versatile and can be saved for repeated use.
- Compare pre-capture vs post-capture filtering for efficiency.
- Build protocol-specific filters like DNS or HTTP for targeted analysis.
- Create attack detection filters to identify malicious activity.
- Save filter profiles for consistent and repeated use.
- Use color coding to highlight filter matches for better visibility.
“Filters in Wireshark transform raw data into actionable insights, making network analysis more efficient and precise.”
By mastering both capture and display filters, you can tailor your analysis to specific needs. This approach ensures you focus on the most relevant data, saving time and improving accuracy.
Advanced Wireshark Features
Wireshark’s advanced features take network analysis to the next level. These tools provide deeper insights into network behavior, making it easier to troubleshoot issues and enhance security. Let’s explore some of these powerful capabilities.
Colorizing Packets for Better Analysis
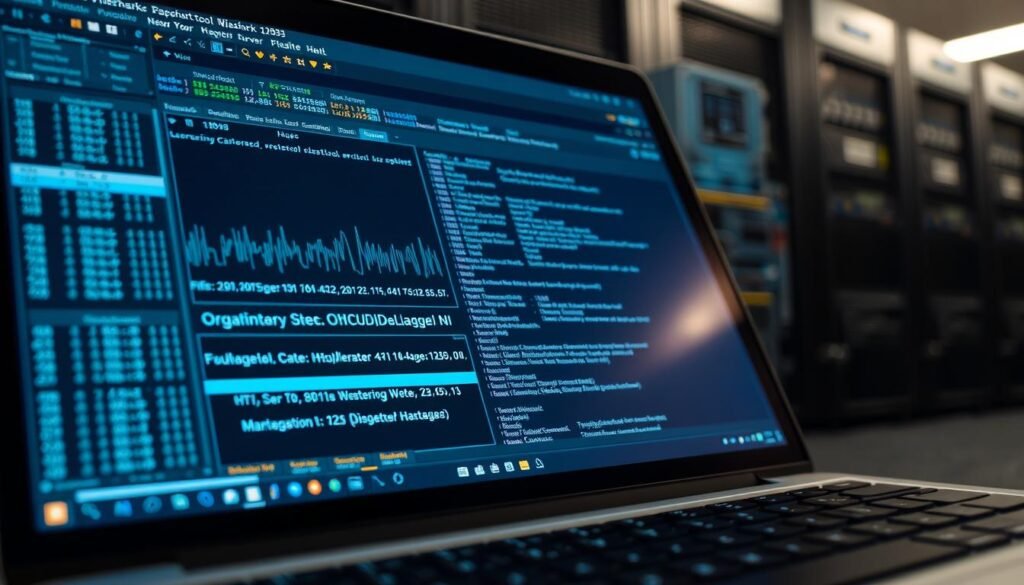
Colorizing packets helps identify critical protocols and anomalies at a glance. Custom color rules can be configured based on filter matches, making it easier to spot specific traffic patterns. For example, you can highlight HTTP traffic in green and TCP errors in red.
This feature is particularly useful for quick diagnostics. It reduces the time spent sifting through large datasets, allowing you to focus on the most relevant information.
Following TCP Streams
Reconstructing TCP streams provides a complete view of conversations between devices. This feature is invaluable for debugging application issues or identifying unencrypted credentials. By following a stream, you can see the entire data exchange in context.
For instance, analyzing a TCP stream can reveal misconfigurations or unauthorized access attempts. It’s a must-have tool for comprehensive network diagnostics.
Extracting Files from Packets
Wireshark allows you to extract files transferred over protocols like HTTP, SMB, or FTP. This feature is useful for recovering documents, email attachments, or other data from captured packets. It’s particularly helpful in forensic investigations or troubleshooting file transfer issues.
For example, you can export a PDF file sent over HTTP or analyze an email attachment for potential threats. This capability enhances both security and diagnostic efficiency.
| Feature | Use Case | Benefit |
|---|---|---|
| Colorizing Packets | Highlighting critical protocols | Quick anomaly detection |
| Following TCP Streams | Debugging application issues | Complete conversation view |
| Extracting Files | Forensic analysis | Recovering transferred data |
“Wireshark’s advanced features transform raw data into actionable insights, making it an essential tool for network professionals.”
- Configure color rules for critical protocols.
- Reconstruct complete file transfers from packets.
- Export email attachments and documents.
- Identify unencrypted credentials in TCP streams.
- Use CLI version (tshark) for automated analysis.
Using Wireshark for Network Troubleshooting
Network diagnostics often require tools that provide detailed insights into system behavior. Wireshark excels in this area, offering the ability to pinpoint network issues and detect potential security threats. By analyzing captured data, we can uncover patterns that reveal underlying problems or malicious activities.

Identifying Common Network Issues
One of the primary uses of Wireshark is diagnosing connectivity problems. For example, high retransmission rates often indicate packet loss or latency. By examining these patterns, we can determine whether the issue lies in the network configuration or hardware.
Another common problem is TLS version mismatches, which can cause connection failures. Wireshark helps identify these errors by analyzing handshake packets. This ensures compatibility between devices and protocols.
Detecting Security Threats
Wireshark is also a powerful tool for identifying security threats. For instance, ARP spoofing can be detected by looking for duplicate IP-MAC pairs in the captured data. This type of attack redirects traffic to malicious devices, compromising network integrity.
SYN flood attacks, a form of DDoS, can be spotted by analyzing the volume of SYN packets. Unusual spikes in these packets often indicate an ongoing attack. Similarly, suspicious DNS requests may reveal data exfiltration attempts.
- Analyze retransmission rates to diagnose connectivity problems.
- Detect port scanning patterns by examining packet timing.
- Identify TLS version mismatches to ensure protocol compatibility.
- Use case study: FTP brute force attack identification.
- Correlate packet loss with interface statistics for accurate diagnostics.
“Wireshark’s ability to uncover hidden network issues and security threats makes it an indispensable tool for modern diagnostics.”
Best Practices for Using Wireshark
To maximize the effectiveness of Wireshark, adopting best practices is essential. These practices ensure optimal performance, legal compliance, and ethical use. By following these guidelines, users can enhance their network analysis while safeguarding sensitive data.
Optimizing Wireshark for Performance
Performance optimization is crucial for handling large-scale network captures. Limiting capture duration prevents overwhelming your system with excessive data. Using a ring buffer allows continuous monitoring by rotating capture files, ensuring no critical information is lost.
Configuring capture buffer sizes is another effective strategy. For large networks, increasing the buffer size improves stability and reduces packet drops. Implementing capture rotation ensures seamless monitoring over extended periods.
Ensuring Legal and Ethical Use
Legal and ethical considerations are paramount when using Wireshark. Always obtain organizational consent before capturing network traffic. This ensures compliance with local laws and organizational policies.
Anonymizing sensitive data protects user privacy. Use anonymization filters to mask IP addresses and other identifiable information. Maintaining a chain of custody documentation is essential for forensic investigations, ensuring the integrity of captured data.
Compliance with GDPR and other data protection laws is non-negotiable. These regulations safeguard user rights and prevent unauthorized access to sensitive information. By adhering to these guidelines, users can ensure ethical and responsible use of Wireshark.
“Adopting best practices in Wireshark ensures efficient performance and ethical compliance, making it a reliable tool for network analysis.”
Conclusion
Mastering network diagnostics empowers professionals to tackle complex challenges with confidence. Throughout this guide, we’ve explored essential skills like capture setup, filtering, and detailed analysis. These tools are vital for understanding traffic patterns and resolving issues effectively.
Continuous learning is key. Wireshark updates regularly, introducing new features and improvements. Staying updated ensures you leverage its full potential. We also recommend pairing Wireshark with complementary security tools for comprehensive protection.
For those seeking advanced expertise, certifications like Wireshark Certified Network Analyst (WCNA) provide deeper insights. These resources help refine your skills and expand your knowledge base.
Finally, always prioritize ethical responsibilities. Use Wireshark only on networks with proper authorization. Ethical practices ensure trust and integrity in your work.
