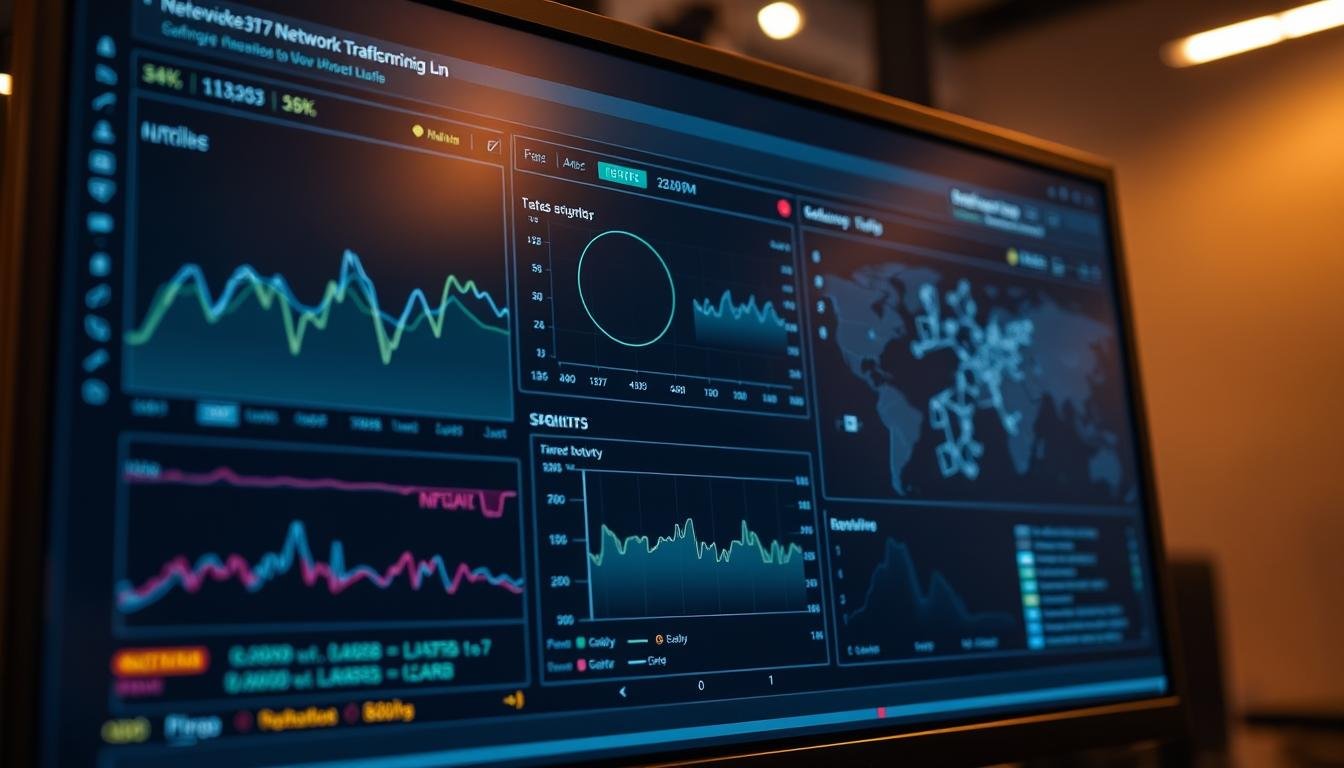
60% of outages are detected first by monitoring tools, not users — a wake-up call for every IT team.
This buyer’s guide shows how to monitor network flows continuously, what to look for in platforms, and how to move from pilot to production with confidence.
We define “real time” as data collected, analyzed, and visualized with minimal delay so teams can spot and fix issues before end users feel them.
Along the way you’ll see core performance and security outcomes, essential tool features, and a pragmatic rollout approach for SMBs and enterprises.
IT Ops, NetOps, SecOps, and business leaders gain shared insights to improve management across on‑prem and cloud infrastructure. We also preview vendors like SolarWinds Observability, Datadog, ManageEngine NetFlow Analyzer, Paessler PRTG, and Sniffnet so you can compare strengths at a glance.
Key Takeaways
- Learn what continuous monitoring delivers: faster detection, fewer incidents, and better uptime.
- Evaluate platforms for dashboards, alerts, analytics, and scalable data collection.
- Balance performance and security needs when choosing tools and policies.
- Follow a staged rollout: pilot, validate, then expand to production.
- Measure benefits in mean-time-to-restore and improved user experience.
What real-time network traffic monitoring is and why it matters today
Continuous observation collects and analyzes telemetry from servers, routers, firewalls, and cloud services so teams see anomalies the moment they begin. This enables faster fixes, fewer outages, and clearer operational insight.

What challenges do modern complex environments create?
Hybrid clouds, SaaS sprawl, remote work, and IoT widen access paths across on‑prem and cloud infrastructure. That growth raises blind spots at device edges and increases alert noise.
Inconsistent telemetry and fragmented tools make diagnosing issues harder. Teams need unified analytics and clearer baselines to cut through noise.
How does a proactive approach improve uptime, performance, and security?
Use anomaly detection driven by machine learning to flag spikes, unresponsive hosts, or attack patterns like DDoS. Alerts can route to email, Slack, or PagerDuty so teams react fast.
Top solutions centralize dashboards showing latency, packet loss, throughput, and bandwidth. That visibility maps directly to outcomes: higher uptime, fewer incidents, and a smoother user experience.
“Continuous data and analytics turn surprise outages into predictable events you can fix before users are affected.”
- Definition: Continuous observation watches traffic, infrastructure, and apps to surface insights the moment issues appear.
- Benefits: Faster detection, better performance, and stronger security posture.
- Pain points: Fragmented tools, telemetry gaps, and noisy alerts complicate effective monitoring.
How real-time monitoring works under the hood
A robust observability stack pulls telemetry from devices, servers, and cloud APIs to build an accurate picture. It then enriches and analyzes that input so teams detect anomalies fast and act with confidence.
Data collection: flows, devices, and endpoints
Start broad, then refine. Ingest raw data from routers, switches, firewalls, servers, VMs, endpoints, and cloud APIs.
Include flow records and packet-derived summaries to cover both macro and granular views of network traffic.
Real-time analysis and machine learning-driven anomaly detection
Normalize metrics, logs, and traces and add context like device role and application owner for faster analysis.
Apply thresholds, baselines, and machine learning models to detect anomalies such as sudden surges or drops that impact performance and security.
Alerts, notifications, and incident response workflows
Route alerts through email, SMS, Slack, or PagerDuty and reduce noise with dynamic thresholds and deduplication.
Configure response playbooks so on-call teams follow runbooks and shorten mean time to repair.
Dashboards, visualization, and reporting for insights
Build dashboards that show key metrics—latency, packet loss, throughput, and error rates—by service and environment.
Compare vendor strengths: SolarWinds adds ML-based anomaly detection, Datadog offers full-stack APM and dashboards, ManageEngine delivers auto-discovery and flow analysis, and Paessler uses sensor-based capabilities.
- Collect: flows and device telemetry.
- Enrich: add context for better analytics.
- Detect: machine learning flags evasive issues.
- Respond: route alerts and embed runbooks.

Core benefits for IT teams and the business
Continuous observation reduces outages, speeds threat detection, and turns historical data into planning-grade insights that save money and time.
Improved reliability and user experience
Continuous systems visibility surfaces issues before apps fail. That leads to better performance and fewer interruptions for every user.
Early detection of bandwidth spikes, hardware faults, or misconfigurations keeps services available and improves the overall experience.
Enhanced security and faster threat detection
Automated alerts flag unusual patterns such as unauthorized access or malware activity. Faster triage cuts dwell and limits breach impact.
Strong signals from analytics help teams prioritize investigations and contain incidents quickly.
Cost savings through prevention and planning
Preventing outages reduces emergency fix costs and lost productivity. Historical data supports capacity planning and helps right-size bandwidth and licenses.
- Elevate reliability: continuous monitoring surfaces issues before outages and improves app performance.
- Strengthen defense: early security signals from unusual traffic patterns enable faster containment.
- Reduce costs: use historical data and analytics to control spend and plan capacity.
- Enhance planning: trend insights support maintenance windows and resilient designs for stable systems.
- Improve collaboration: shared dashboards align operations and management on SLAs and business priorities.
“Fewer disruptions and clearer analytics turn operational risk into predictable outcomes you can manage.”

For a deeper look at why continuous observation matters, see the importance of network monitoring.
Key features to prioritize in monitoring tools
Pick features that cut noise, speed response, and scale with growth. Focus on alerts, dashboards, integrations, and security capabilities that give teams clear, actionable insights.
Alerting depth matters most. Configure alerts with dynamic thresholds and escalation policies. Send notices via email, SMS, Slack, or PagerDuty so the right engineers get notified fast.
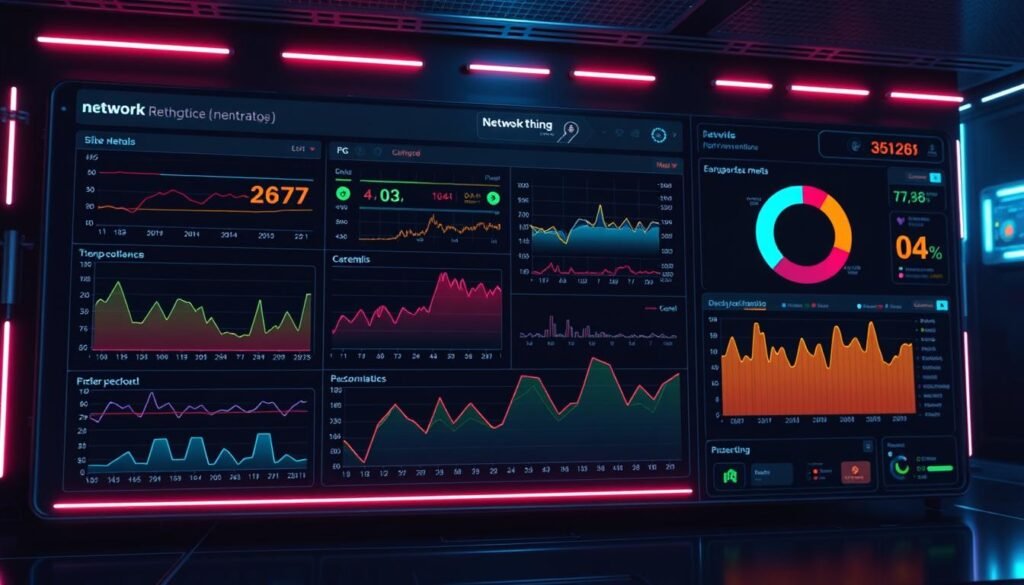
Dashboards must be role-aware. Give each team customized views and controlled access. That keeps metrics and performance signals front and center for ops, security, and managers.
Check scalability across cloud and edge devices. The tool should handle hybrid environments and cloud-native workloads without runaway costs.
Integrations and automation streamline work. Connect with ITSM, CI/CD, and SIEM, and trigger scripts or workflows on threshold breaches to lower MTTR.
Insist on detailed reporting. Export auditable reports for SLOs, compliance, and stakeholder reviews. Compare vendor capabilities—SolarWinds for advanced reporting, Datadog for APM and alerts, Paessler for sensor-based dashboards, and ManageEngine for discovery and bandwidth insights.
“Tools that cut noise and automate routine fixes free teams to focus on high-value incidents.”
For a practical guide to building alerting and dashboard policies, see this monitoring guide.
Who needs real time network traffic monitoring
If your business relies on apps, a steady feed of metrics and alerts improves resilience and reduces downtime. This applies to small shops, global enterprises, and cloud-first teams that run elastic services.
SMBs and small teams
Smaller businesses gain big wins from simple, affordable tools that cut complexity.
ManageEngine fits well here: it’s usable, cost-effective, and helps control bandwidth and costs without heavy ops staff.
Enterprises and multi-domain operations
Large organizations need cross-domain visibility across data centers, cloud, and branch locations.
SolarWinds Observability offers hybrid coverage and scale to map complex networks and speed incident response.
Cloud-first and specialist users
Dynamic microservices and short-lived instances demand elastic solutions. Datadog excels for cloud-native stacks.
For sensor-heavy environments, Paessler PRTG provides diverse telemetry, while Sniffnet is a good, free option for individuals learning about network traffic and bandwidth patterns.
- Right-size your stack: match tool depth to SLAs and compliance needs.
- Keep management simple: prioritize onboarding, day‑2 operations, and clear ownership.

Top monitoring solutions to evaluate
Which vendors fit your visibility, analytics, and deployment needs?
Compare how each solution collects and presents data so you can match features to SLAs and staff skills.
SolarWinds Observability
End-to-end visibility for hybrid infrastructure with ML-based anomaly detection and rich reporting. Choose SaaS or self-hosted deployment to fit on‑prem or cloud environments.
Datadog
Full-stack observability with APM, broad integrations, and live analytics. It unifies logs, traces, and performance KPIs on customizable dashboards for cloud-native teams.
ManageEngine NetFlow Analyzer
Flow-first toolset supporting NetFlow, sFlow, IPFIX and more. Use its conversation views, QoS checks, and interface-level alarms for precise bandwidth and traffic analysis.
Paessler PRTG
Sensor-driven design with drag-and-drop dashboards and deep device coverage. Flexible licensing suits mixed estates and distributed sites.
Sniffnet
Free, open-source, cross-platform tool with strong UX. Inspect traffic, export PCAP, identify services and hosts, and preserve privacy-friendly security controls.
- Fit checklist: weigh ML coverage, visualization fidelity, deployment model, and integration depth.
- Verify support: review vendor roadmap, update cadence, and community resources.

| Vendor | Key strength | Best for |
|---|---|---|
| SolarWinds Observability | ML anomaly detection, hybrid visibility | Enterprises needing full-stack reporting |
| Datadog | APM + integrations + live analytics | Cloud-native teams and microservices |
| ManageEngine NetFlow Analyzer | Flow analysis and bandwidth insight | Teams focused on interface-level troubleshooting |
| Paessler PRTG | Custom sensors, flexible dashboards | Heterogeneous device estates |
| Sniffnet | Open-source, privacy-focused UX | Small teams and learning labs |
For a broader checklist of network monitoring tools, use that guide to shortlist candidates before piloting.
Deep-dive: flow-based traffic monitoring for granular insights
Flow exports convert packet volumes into actionable conversation, bandwidth, and application reports within minutes.
Analyzing exported flows gives a clear map of bandwidth use and application behavior across devices. Start by enabling exporters on routers and switches; within minutes, graphs and reports appear.
Which flow formats should you expect?
ManageEngine NetFlow Analyzer supports NetFlow, sFlow, cFlow, J-Flow, NetStream, AppFlow, and IPFIX from vendors such as Cisco, Juniper, HP, and Extreme. That broad support widens visibility across mixed infrastructure.
What insights come from flow analysis?
Minute-refresh graphs show bursts, utilization, and bandwidth saturation. Conversation reports list top talkers and source/destination pairs. App/port/protocol analysis exposes misclassified or toxic apps and guides QoS and segmentation choices.
How do interface metrics and alarms help operations?
Per-interface views reveal DSCP marks and class-based policy efficiency. Configure alarms by utilization, duration, and frequency to cut noise and focus detection on business-critical services.

| Capability | What it shows | Why it matters |
|---|---|---|
| Flow formats | NetFlow, sFlow, J-Flow, AppFlow, IPFIX | Multi-vendor visibility across device families |
| Traffic graphs | Minute-by-minute utilization and bursts | Fast detection of saturation and spikes |
| Conversation reports | Top talkers, src/dst pairs | Pinpoints lateral movement and load sources |
| Interface analytics | DSCP, QoS efficiency, per-port stats | Validates policy and capacity decisions |
To compare flow and deep-packet methods, see a short primer on flow vs. DPI analysis. Quick setup and clear dashboards make flow-first tools a practical choice for ongoing management.
Evaluating tools: metrics, capabilities, and fit
Start evaluations by asking which metrics the platform records and how often it refreshes them. These answers reveal whether a tool meets SLA, security, and capacity needs.
Which performance metrics matter?
Require consistent tracking of latency, packet loss, throughput, and bandwidth. Correlate those metrics with logs and traces for quick diagnosis and deeper performance forensics.
How mature is anomaly detection?
Test machine learning-based detection for baseline adaptation, model transparency, and reduced false positives. Confirm the platform supports behavior analytics so alerts map to real incidents.
Does it cover hybrid environments and integrate well?
Validate multi-cloud coverage, edge and on‑prem discovery, and vendor support. Check APIs, SSO, encryption, and exportable data for audits and leadership insights.
“Pilot with identical workloads to compare signal quality, MTTR, and false positive rates across platforms.”
- Score integrations: SIEM, ITSM, APM, and messaging bus.
- Review support: SLAs, roadmap, and community maturity.
- Pilot with intent: bake-offs that measure cost against the core metrics you use.
Implementation playbook: from pilot to production
Start small, validate quickly, then scale with clear guardrails. A focused pilot confirms exporters, dashboards, alerts, and runbooks before wider deployment. This approach lowers risk and proves value to stakeholders.
Discovery and export configuration
Inventory domains, critical apps, and dependencies. Enable NetFlow, sFlow, or IPFIX on routers and switches so flow-based tools populate dashboards within minutes.
Tip: Use a single site or VLAN as a pilot to limit blast radius while you verify parsing and charting.
Baseline creation and analysis
Collect at least two business cycles to build baselines for traffic, performance, and security signals. Use visual trends to set thresholds and avoid noisy alerts.
Alert tuning, automation, and runbooks
Tune alerts with rate limits and dynamic thresholds. Route notifications to Slack or PagerDuty and document clear response steps for on-call teams.
Automate common fixes—service restart, route failover, QoS changes—and store scripts in runbooks to cut mean time to repair.
Secure access and operational management
Enforce role-based access, SSO/MFA, and encrypted transport. Log configuration changes so audits and change reviews remain simple.
- Measure outcomes: track incident volume, MTTR, and SLA adherence.
- Plan rollout: phase by domain with rollback windows and change control.
- Optimize: revisit baselines quarterly as mixes and bandwidth needs evolve.
“Pilot with a focused scope; prove alerts and automation first, then scale with measured confidence.”
| Phase | Key actions | Success metric |
|---|---|---|
| Discovery | Inventory systems, enable exporters, start capture | Dashboards populate; sample flows visible |
| Pilot | Build baselines, tune alerts, validate runbooks | False positives |
| Production | Staged rollout, RBAC, continuous optimization | SLA adherence, reduced incident volume |
Budget, licensing, and total cost of ownership
How much will your observability stack really cost, and what drives long‑term spend?
Modeling expenses up front prevents surprises. Include license fees, ingestion and storage of data, hosted versus self‑hosted infrastructure, and the people hours for ongoing monitoring.
Vendors use different pricing levers: per‑host, per‑sensor, per‑GB ingested, or tiered feature plans. A per‑sensor model like Paessler PRTG can be cheap at small scale but rise as sensors multiply. Per‑GB pricing can balloon if your traffic peaks frequently.
Weigh SaaS versus self‑hosted tradeoffs. SaaS reduces platform management overhead and patching, while self‑hosted options (SolarWinds Observability offers both) may lower long‑term platform costs and give more control.
Prioritize required capabilities to avoid overbuying. Map features—flow analytics, ML anomaly detection, reporting—to concrete benefits such as fewer incidents and better performance, then assign dollar values to those benefits.
- Include security hardening: budget for encryption, RBAC, and compliance reporting for regulated businesses.
- Preserve flexibility: require the ability to export data and pilot costs with real network loads to avoid lock‑in.
- Plan capacity: add reserves for peak traffic and incident surges and track issues to refine forecasts.
For a structured TCO framework and checklist, see this CTO’s guide to total cost of to validate assumptions and build a defensible budget.
Conclusion
Continuous visibility turns raw telemetry into fast, actionable steps that reduce outages and improve service reliability. Apply a clear, proactive approach so teams detect anomalies before users see impact.
What to do next: shortlist monitoring tools that match your stack, run a pilot under load, and codify response playbooks so systems recover quickly.
Keep optimizing: track bandwidth trends, refine thresholds, and use analytics and learning to improve signal quality. With steady practice, network traffic visibility and reliable network monitoring make operations smoother and the user experience measurably better.
FAQ
What is real-time network traffic monitoring and why does it matter today?
Real-time monitoring continuously collects and analyzes data from devices, flows, and endpoints to show current conditions. It matters because modern infrastructures are hybrid and cloud-first, so visibility is essential to maintain uptime, optimize bandwidth, and detect threats quickly to protect user experience and business operations.
What challenges do teams face in complex network environments?
Teams juggle fragmented telemetry across on-prem, cloud, and edge systems, varying device vendor data, and encrypted traffic. These conditions make it hard to correlate events, tune alerts, and keep thresholds meaningful without automated analysis and scalable collection.
How does a proactive approach improve uptime, performance, and security?
A proactive stance uses continuous baselining, anomaly detection, and automated alerts to spot degradation or threats before users notice. That reduces mean time to detect (MTTD) and mean time to repair (MTTR), prevents outages, and limits security exposure.
How is monitoring data collected from flows, devices, and endpoints?
Tools collect NetFlow/sFlow/IPFIX exports, packet captures, SNMP metrics, and telemetry APIs from cloud services and endpoints. Agents, collectors, and taps aggregate this telemetry for unified analysis while preserving scalability and retention policies.
How do machine learning and analytics drive anomaly detection?
Machine learning models create behavioral baselines for hosts, applications, and links, then flag deviations in throughput, protocol mix, or session patterns. ML reduces false positives, prioritizes incidents, and surfaces subtle threats that simple thresholds miss.
What role do alerts and incident workflows play?
Alerts translate detected anomalies into actionable items. Integrated workflows route incidents to the right teams, automate remediation steps, and tie into ticketing and orchestration tools to accelerate response and maintain audit trails.
What should I expect from dashboards and reporting?
Effective dashboards offer customizable, role-based views showing latency, packet loss, top conversations, and application performance. Reports provide historical trends for capacity planning, SLA compliance, and security forensics.
What core benefits do IT teams and businesses gain?
Teams gain improved reliability and user experience, faster threat detection, and reduced operational costs through prevention and targeted capacity planning. Business leaders get better uptime, predictable performance, and measurable ROI.
How does monitoring enhance security and threat detection?
Monitoring detects lateral movement, unusual ports, and bandwidth spikes that indicate exfiltration or DDoS. Correlating flow and endpoint data improves detection fidelity and speeds incident investigation.
Which features should I prioritize when evaluating tools?
Prioritize low-latency alerts, customizable dashboards, role-based access, scalability for hybrid and cloud-native environments, integrations with SIEM and automation platforms, and compliance-supporting reporting.
How important are integrations and automation?
Very. Integrations with orchestration, ticketing, and security platforms enable faster remediation and context-rich investigations. Automation reduces manual toil and enforces consistent incident responses.
Who benefits most from these monitoring solutions?
SMBs, enterprises, and cloud-first teams all benefit. Small teams gain faster troubleshooting and security posture; large organizations need scale, multi-tenant views, and advanced analytics for distributed infrastructure.
Which commercial solutions are worth evaluating?
Consider SolarWinds Observability for hybrid visibility, Datadog for full-stack analytics and APM, ManageEngine NetFlow Analyzer for flow-based bandwidth insights, and Paessler PRTG for sensor-driven coverage. For open-source options, explore Wireshark and Zeek alongside lightweight collectors like ntop (not a commercial endorsement).
What is flow-based monitoring and why use it?
Flow-based monitoring (NetFlow, sFlow, IPFIX, AppFlow) summarizes conversations between endpoints to show top talkers, application use, and protocol distribution. It scales well for bandwidth planning and fast anomaly detection without full packet capture.
Which flow technologies should I check for support?
Ensure the tool supports NetFlow, sFlow, IPFIX, and vendor-specific formats like J-Flow or AppFlow. Broad flow support ensures consistent telemetry across diverse devices and cloud appliances.
What performance metrics matter when evaluating tools?
Focus on latency, packet loss, throughput, and bandwidth utilization. Also evaluate anomaly detection quality, ML readiness, retention, and the ability to correlate across logs, traces, and flows.
How should I approach implementation from pilot to production?
Start with discovery to map devices and traffic sources. Configure exports or agents, establish baselines, and pilot with key segments. Then tune alerts, build runbooks, and scale collection and retention according to SLAs and compliance needs.
How do I tune alerts to reduce noise?
Use baseline-driven thresholds, suppress known maintenance windows, apply role-based filters, and leverage ML scoring to prioritize alerts. Regularly review false positives and update rules as traffic patterns change.
What are the main cost considerations and licensing models?
Costs vary by device count, sensor or agent licensing, data ingestion rates, and retention period. Consider total cost of ownership: storage, analysis, integrations, and the staffing required to operate the system.
How can monitoring support compliance and audits?
Monitoring provides logs, flow records, and reports that demonstrate access, performance, and security controls. Look for built-in templates for HIPAA, PCI, or SOC frameworks and tamper-evident audit trails.
How do I measure success after deployment?
Track reduced MTTD/MTTR, fewer user complaints, improved SLA adherence, and cost savings from prevented outages. Use before-and-after baselines to quantify operational and business impact.
