
Curious what really flows across a home or office network when a page stalls or a login hangs? That question drove my first hands-on session and it will guide your first steps too.
This short intro sets a clear goal: get oriented, run a short capture, and note useful details without getting lost in the display. Wireshark is an open-source tool that grabs packets from Ethernet, Wi‑Fi, and Bluetooth and saves raw data for later analysis.
Start small. Learn what a single packet looks like, spot source and destination addresses, and read timing clues. That quick pattern recognition boosts troubleshooting and security awareness.
Guardianship matters: capture only where you have explicit permission. Unauthorized packet collection is unlawful and unethical.
Expect version differences, but core steps stay steady—pick an interface, hit Start, stop when ready, then apply simple filters to surface clear information.
Key Takeaways
- Wireshark reveals raw packet-level activity so you can see who talks to whom.
- Run brief captures first; small samples often yield practical insights.
- Focus on sources, destinations, and timing before diving into protocols.
- Always obtain explicit permission; unauthorized capture is illegal.
- Filters cut noise and make the display useful on day one.
Why I Opened Wireshark Today: Goals, Expectations, and the Beginner Mindset
My goal this session was simple: run a short capture, spot who my system talks to, and learn one useful filter.This short, focused practice shows real value quickly and keeps attention on the details that matter.
Set three clear goals: understand what a short capture looks like, identify peers your computer contacts, and apply a single display filter to cut noise. These goals keep a session tight and productive.
Plan your time. A five-minute capture often surfaces useful patterns without overwhelming you. Short sessions make it easier to review each packet and learn.
Adopt a security-first mindset: only capture on networks where you have permission. Avoid recording sensitive payloads unless you run an approved test.
Expect background chatter by default. Modern networks show many small exchanges. A simple filter boosts signal-to-noise so you can see meaningful traffic fast.
Start and stop using the toolbar, the Capture menu, or Ctrl+E. Pick the path you prefer and keep your workflow predictable while learning.
| Goal | Action | Value |
|---|---|---|
| See short capture | Run 5-minute capture | Quick, reviewable sample |
| Identify peers | Note source/destination addresses | Know who talks to you |
| Reduce noise | Apply one display filter | Clearer packet details |
Capture with intent: write a short question before you click Start, such as “Does my PC reach the gateway?” That focus makes the details you record easier to interpret later.
Value incremental wins. Isolate one protocol exchange, review it, then rest. Fresh eyes reveal new details on repeat reviews.

What Wireshark Is and When You Should Use It
Think of Wireshark as a microscope that decodes live network chatter into readable pieces. Use it to troubleshoot connections, verify responses, or learn how protocols behave under real conditions.
Think in parts: the tool captures packets, decodes protocol fields, and shows timing and address information so you can read application flows and handshake sequences.
How does it help with troubleshooting and learning?
Practical uses include spotting slow apps, validating DNS replies, and confirming whether a TCP handshake completes. Each packet shows flags, addresses, and timing that reveal where a problem sits.
What limits and rules should you know?
- Scope: your system sees its own traffic plus local broadcast and multicast. To inspect beyond that requires taps or port mirroring.
- Filters: capture filters reduce what is stored; display filters refine what you view during analysis.
- Ethics: obtain permission before capture. Respect organizational policy and legal boundaries to protect privacy and security.
Tip: pick one protocol such as ARP or ICMP, click a packet, and read the details field to learn each step.
Getting Wireshark Installed the Right Way on Your System
Install carefully to avoid capture and permission problems later. Follow platform-specific steps so the tool shows active interfaces and saves capture files reliably.
Start by picking the right installer and confirming driver options. On Windows, download the Windows Installer from wireshark.org for your architecture. When prompted, install Npcap; allow the newer version if one exists. Skip USBPcap unless you need USB traffic capture.
How should I install on macOS?
With Homebrew, run the command brew install wireshark. That pulls dependencies and the GUI. Launch from Applications or via Terminal once install completes.
What are the Linux options and post-install steps?
Ubuntu: use sudo apt-get install wireshark, then sudo dpkg-reconfigure wireshark-common and add your user to the wireshark group.
Fedora: sudo dnf install wireshark-qt and run sudo usermod -a -G wireshark username. Kali usually includes it under “Sniffing & Spoofing.” Reboot if drivers need to load.
“Document the version you install and any special settings for audit and repeatability.”
- Keep installer defaults unless policy requires otherwise.
- After install, confirm at least one active network interface appears and you can save a capture file.
- Maintain a secure posture: download only from the official site and validate signatures when available.
First Launch: Choosing a Network Interface and Learning the GUI
Pick the network adapter that carries your Internet traffic by watching live counters next to each entry. The GUI also shows a capture filter field you can set before you begin.
How do I select the correct interface and options?
Verify an adapter by observing its packet rate or by choosing the adapter you use for web access. Enable or disable promiscuous mode depending on policy and your test needs. Start capturing via the toolbar Start button, the Capture > Start menu, or press Ctrl+E.
What are the three main panes in the window?
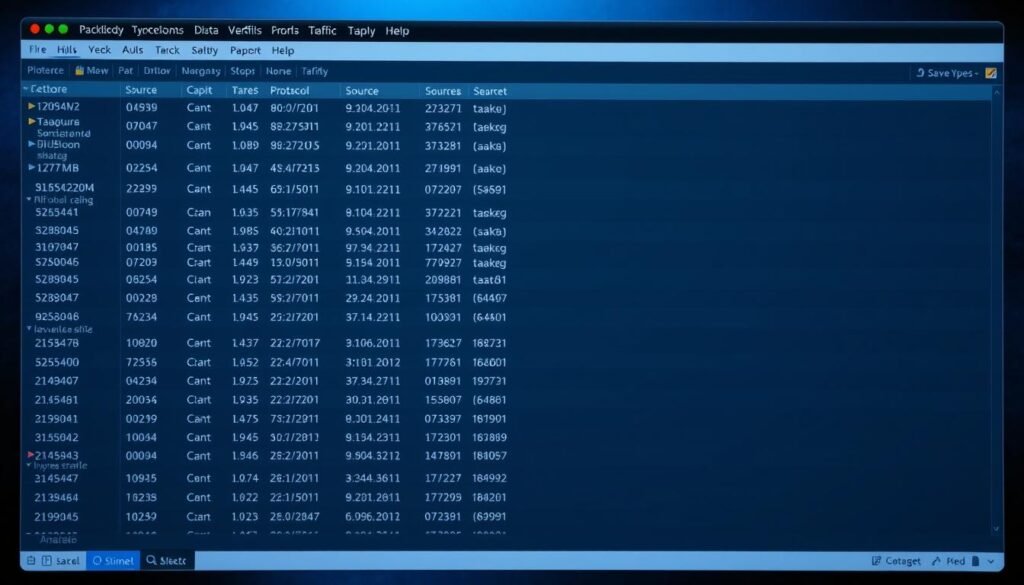
The top pane is the packet list. It updates in real time and shows No., Time, Source, Destination, Protocol, Length, and Info.
The middle pane shows packet details. Expand protocol layers and right-click fields to create quick display filters.
The bottom pane contains packet bytes, the raw frame in hexadecimal for byte-level inspection.
When should I stop capture?
Begin capture only when ready, then stop capture after a short window to keep analysis focused. If the display doesn’t match expectations, pause and confirm the chosen interface before continuing.
“Choose one workflow—toolbar, menu, or shortcut—and use it consistently while you learn.”
- Keep the window tidy by closing extra tabs.
- Watch packet list columns to spot protocol trends fast.
- Use right-click in the packet details pane to build filters without typing.
| Pane | Primary View | Quick Action |
|---|---|---|
| Packet List | Rows showing No., Time, Source, Destination, Protocol, Length, Info | Sort or click to follow streams |
| Packet Details | Decoded protocol tree with expandable fields | Right-click to apply display filter |
| Packet Bytes | Raw hexadecimal and ASCII representation | Inspect payload and checksums |
Filters That Matter: From Noisy Traffic to Focused Insights
Filters turn a noisy capture into targeted evidence you can act on fast. Use the right capture and display filters to save disk space and speed analysis.
How will capture filters control what gets saved?
Apply capture filters before you start to restrict which packets hit disk. Examples include host 192.168.1.5, net 192.168.0.0/24, dst host 10.0.0.2, port 53, or port not 53 and not arp.
How do display filters refine the packet list after capture?
Display filters let you slice the Packet List without losing data. Try ip.src==192.168.1.5 and ip.dst==8.8.8.8, ip.addr==192.168.1.5, tcp.port eq 25, icmp, or ip.addr != 10.0.0.1.
- Save space: capture filters limit writes so files stay small and relevant.
- Preserve flexibility: record broadly when unsure, then refine with display filters.
- Split direction: use
ip.srcandip.dstto separate source and destination flows. - Service focus: filter by
tcp.portorudp.portto isolate protocol behavior. - Build quick filters: right-click fields in Packet Details to create precise commands without typing.
“Test capture and display syntax in a lab before relying on it in production.”
Hands-On Diary Entry: Capturing and Analyzing ARP Traffic
Choose the active adapter and apply an arp display filter so you only see link-layer resolution traffic. This keeps the capture focused and speeds learning.
Start capture, then from a Command Prompt ping your gateway or another LAN host. The initial exchange triggers ARP requests and replies before any ICMP data flows.
Stop capture after the short test. In the packet list, find an ARP frame that shows your host as source and broadcast as destination. Select that frame and click packet to inspect fields.
Open the packet details pane and expand Ethernet II to read Source and Destination MAC values. Expand Address Resolution Protocol to see the request text, like “Who has 192.168.1.1? Tell 192.168.1.100.”
Peek at the packet bytes pane to match raw bytes to decoded fields. On Windows, run arp -a to confirm the IP-to-physical address mapping now exists in your cache.
- Capture a second example by pinging another host and compare source/destination fields.
- Note timing: ARP requests occur just before the first echo reply; replies populate the local cache.
Working Smarter in Wireshark: Modes, Commands, and Stats
Small, scripted captures save time and produce repeatable results for later review. Use the CLI to record predictable files, then open them in the GUI for deeper analysis.
Consider enabling promiscuous mode only when your environment permits it and you need broader LAN visibility. By default, the tool captures local host traffic; promiscuous can reveal additional peers on shared media.
The command line is your friend for repeatable work. Run wireshark -h to view options. Use a sample command like wireshark -a duration:300 -i eth1 -w capture.pcap to stop automatically and write a clean capture file.
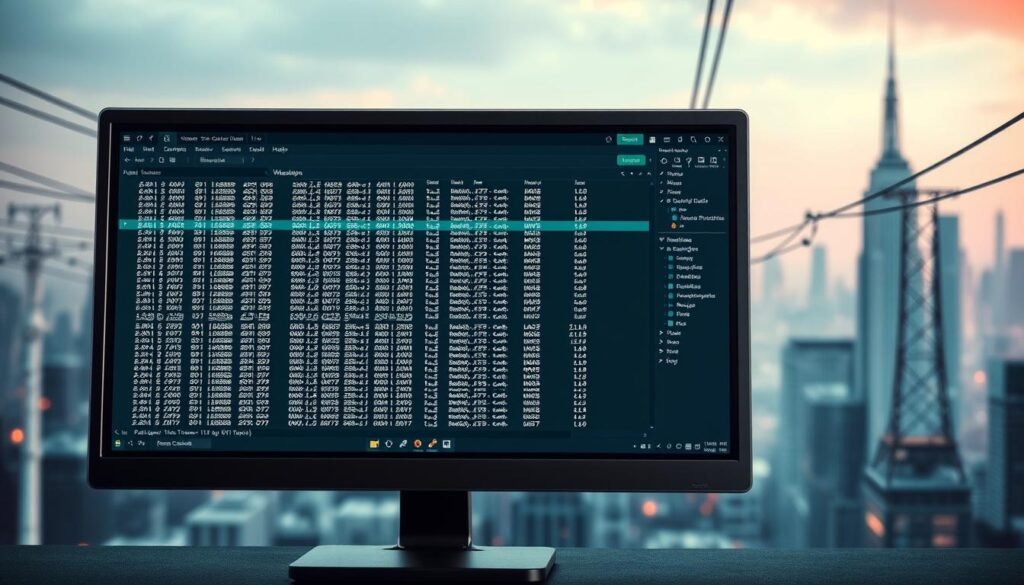
Under the Statistics menu explore Capture File Properties, Metrics, and I/O Graphs. These views reveal throughput bursts, steady traffic, and gaps at a glance.
- Script short captures; name files by case or date.
- Combine interface, duration, and output file to avoid runaway captures.
- Verify each file opens in the GUI window before sharing.
“Record with intent: capture only what you need, then pivot to the panes that matter for byte-level validation.”
a beginner’s diary of using wireshark for the first time: What I Learned by Following the Packets
The packet list is your roadmap; read No., Time, Source, Destination, Protocol, Length, and Info like timestamps in a play. The top pane shows the number order and quick clues that speed analysis.
Scan the No. column to mark key transitions. Use the Info column to spot protocol milestones and quickly find where a flow begins or stalls.
Practical lessons on filters, conversations, and packet information
I used right-click to Follow streams and build filters without typing. Pairing ip.src and ip.dst narrowed packets to one source and one destination so each step read cleanly.
The packet details pane showed nested protocol layers and field changes across request/response pairs. The packet bytes view then confirmed decoded values match on-wire data.
- Count the number number in short exchanges to learn timing and structure.
- Apply filters to reduce noise and validate each packet in a conversation.
- Save focused captures so teammates can reopen the same GUI view later.
| Action | What to read | Value |
|---|---|---|
| Scan Packet List | No., Time, Info | Find milestones fast |
| Open Packet Details | Layer tree, addresses, ports | Understand protocol steps |
| Check Packet Bytes | Raw hex / ASCII | Confirm decoded values |
| Follow Stream | Filtered conversation | Isolate point-to-point flow |
For a practical guide, see this short write-up on core concepts and filters: TryHackMe Wireshark basics. Keep captures small, review each packet, and assign clear value to every observation to turn raw information into useful analysis.
Conclusion
A short, repeatable routine turns scattered captures into reliable evidence you can trust. Save the capture file, note the interface and version, and label filters used so later review is fast and clear.
Keep captures small and purposeful. Use display filters to focus traffic and read the packet list first. Then open the packet details pane and click packet to inspect any selected packet bytes for exact fields.
Count frames, check time gaps, and document key findings. Respect scope and privacy while you learn. With disciplined habits, this tool becomes both a learning resource and a professional instrument for network protocol analysis.
