Can one free tool turn raw network data into clear, defensible evidence during an incident? That question drives this article.
Wireshark captures live traffic across Windows, macOS, and Linux and decodes thousands of protocols. This open-source tool converts complex streams into readable details that help analysts find root causes fast.
Expect hands-on workflows and practical tactics for installation, interface mastery, filters, profiles, and export options. You will learn how to isolate high-signal traffic, pivot from symptoms to cause, and produce evidence suitable for audits.
Security-aware practices are woven into each step: avoid unauthorized captures, disable external DNS lookups in the tool, and handle encrypted data responsibly.
For a focused walkthrough on captures and live triage, see this in-depth walkthrough: learn how to use Wireshark.
Key Takeaways
- Wireshark is a free, open-source network protocol analyzer that supports thousands of protocols.
- Practical steps cover installation, filters, profiles, streams, statistics, and exporting objects.
- Use protocol hierarchy, IO graphs, and color rules for faster triage.
- Follow security best practices: no unauthorized captures and safe resolution settings.
- Combine this tool with command-line and SIEM tools for full-spectrum visibility.
Why Wireshark Matters for Modern Network and Security Operations
Line-of-sight into frames and protocols lets teams map symptoms to root causes during outages or attacks. It turns raw network traffic into clear facts for ops, security, and development teams.
Live capture and deep inspection help you spot latency, packet loss, and malformed protocols fast. Analysts detect unauthorized exfiltration, distributed denial-of-service behavior, and misconfigurations by inspecting headers and payloads.
Value spans roles:
- Operations: find routing or DNS missteps that cause outages.
- Security: confirm suspicious flows and reconstruct timelines for incident response.
- Developers & educators: validate protocol behavior during integration and demos.
Operational gains include faster mean time to resolution by linking slow applications with transport or application-layer causes. Pivot from IDS alerts into captured frames to verify ground truth before you block or patch. Always capture within authorized scopes and treat saved data as sensitive evidence.
| Common Use Cases | Typical Benefit | Relevant Feature |
|---|---|---|
| Troubleshoot latency | Reduce MTTR | Live capture & timestamps |
| Detect exfiltration | Forensic timelines | Flow inspection & payload view |
| Debug protocols | Faster integration | Decode and reassemble streams |
| Teach networking | Real-time demos | Human-readable fields & raw bytes |
Understanding Packets, Protocols, and Network Traffic Essentials
Treat each captured frame like a mini forensic record — it documents source, hops, and payload details.
Reading headers across layers reveals whether faults live in physical, routing, transport, or application tiers.
Packets travel through layered stacks: Ethernet → IP → TCP/UDP → application (for example, HTTP or DNS). Wireshark decodes fields at every layer and links decoded lines with raw hex for fast verification.
Follow this compact example: inspect an HTTP request from source toward destination. Check IP addressing, TCP flags, sequence and ack numbers, then confirm application headers match expected method and host.
- Why inspect headers: each header narrows root cause: link errors, misrouting, retransmits, or malformed application fields.
- DNS role: correlate queries and responses to spot misresolution, caching problems, or blocked domains.
- Symptom mapping: timeouts often match retransmissions, fragmentation, or MTU mismatches visible in flags and lengths.
| Layer | What to check | Common symptom |
|---|---|---|
| Link (Ethernet) | MACs, frame size | CRC errors, drops |
| Network (IP) | Addresses, TTL | Routing loops, wrong next hop |
| Transport (TCP/UDP) | Flags, seq/ack, ports | Retransmits, connection resets |
| Application | Headers, payload | Malformed requests, bad responses |
Consistent field-by-field review prevents missed clues in options, flags, and headers. For malware and suspicious flow detection, see a practical write-up at detect malware in network traffic.
Installation and Setup Across Windows, macOS, and Linux
Prepare hosts carefully so captures work reliably and permissions do not block interfaces. Follow OS-specific steps, confirm access, and prefer pcapng for richer metadata.
Start by preparing each host so captures work reliably across Windows, macOS, and Linux.
Windows, macOS, Linux prerequisites and permissions
Windows: download the installer and enable Npcap during setup. Npcap provides low-level access needed for live capture and better performance.
macOS: install with Homebrew: brew install –cask wireshark. Grant accessibility and network permissions when prompted.
Linux: use your package manager (apt or yum) and add your user to the wireshark group with sudo usermod -aG wireshark <username>. Log out and back in to apply group membership.
- Permission issues: empty interface lists usually mean driver or group problems. Re-run the installer or re-check group membership and relog.
- Verify: open the tool and confirm the target interface (Ethernet or Wi‑Fi) appears before a critical session.
- Updates: keep the software current so new protocol dissectors and features arrive on time.
| OS | Install Step | Permission Fix | Recommended format |
|---|---|---|---|
| Windows | Run installer, enable Npcap | Reinstall Npcap, run as admin | pcapng |
| macOS | brew install –cask | Grant network access in System Preferences | pcapng |
| Linux | apt/yum install wireshark | usermod -aG wireshark + relog | pcapng |
Practical tips: close heavy apps during capture, store files on fast local disks, and use ring buffers for long runs. Save captures in pcapng to preserve interface details and comment blocks. These small steps reduce data loss and system issues during forensic work.
Wireshark Interface Deep Dive: Packet List, Details, and Bytes
Learn how the three-pane interface reveals context fast. Short, linked views speed triage and reduce guesswork when you inspect network captures.
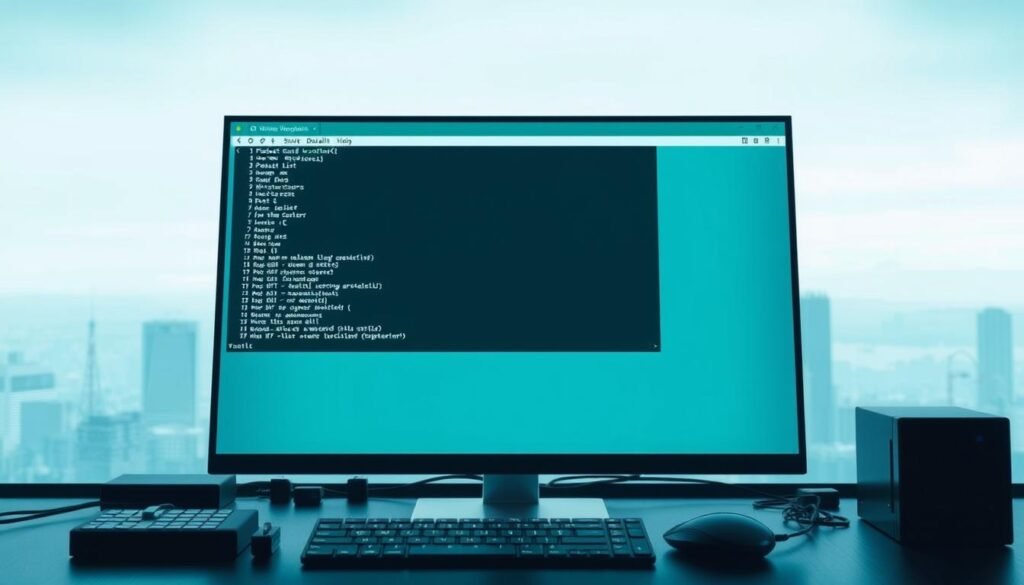
What each pane shows and why it matters
The top list gives a quick summary: Time, Source, Destination, Protocol, and Info. It helps you scan many records and spot odd flows.
The middle pane exposes layered details. Expand frames to read IP, TCP, and application fields. Synchronized highlighting maps fields to raw bytes.
The bottom pane shows hex and ASCII. This raw view proves what the decoder shows and reveals hidden markers.
Customize columns and layouts
Add columns like http.user_agent, http.host, dns.qry.name, tcp.stream, and port fields. These surface key context in the list view so you spot threats faster.
Pick among six layouts for small or wide screens. Move panes when presenting or triaging so important fields stay visible.
Time formats, name resolution, and productivity
Switch time formats (seconds since start, UTC, local, microseconds). Use UTC for capture metadata and note in-packet headers may reflect other zones.
Rely on captured dns data for name resolution. Avoid external resolvers that may leak queries. Save task-specific profiles and store display filters with each profile for repeatable workflows.
| Pane | Main Content | Quick Use |
|---|---|---|
| Packet List | Time, Source, Destination, Protocol, Info | Scan flows, sort by host or protocol |
| Packet Details | Layered decode (IP, TCP, HTTP) | Inspect headers and options |
| Packet Bytes | Hex and ASCII | Verify payload, spot obfuscation |
Capture Filters vs Display Filters: When and How to Use Each
Capture selectors run before data hits disk; display filters let you slice decoded fields after the fact. Choose capture rules when volume risks dropping packets, and use display rules for fine-grained investigation.
Capture filters (BPF) execute at kernel level and limit what is written. Use them on busy links to control file size and reduce noise. A lean capture example: tcp port 80 or host 192.168.1.1.
Display filters run after capture on decoded fields. They let you search deep protocol fields like http contains “hack”. Keep broad captures and refine with display filters when you need pivot room.
- Tradeoff: tight capture rules can drop context; broad captures preserve evidence but raise storage and processing needs.
- Stability: use ring buffers, file size limits, and short capture windows when monitoring high-throughput traffic.
- Reproducibility: document chosen filters so teammates know why flows appear or are missing.
| Type | When to use | Example |
|---|---|---|
| Capture | High volume, reduce disk use | tcp port 80 |
| Display | Post-capture for precise queries | http contains “hack” |
| Strategy | Combine both for flexibility | Ring buffers + staged filters |
Remember that complex display operations on large files can slow tools. For tips on practical filter building and staged refinement, use display filters as part of a measured workflow.
Mastering Display Filters for Precision Analysis
Good filters turn noisy captures into targeted evidence quickly and reliably.
Learn simple expressions, how the stoplight helper validates syntax, and practical http and dns patterns that work in real investigations.
Start with operators: ==, contains, in, and matches. Use the stoplight helper: green shows valid syntax, yellow warns of logic quirks, and red flags errors before you run expensive queries.
Common queries that speed triage
Examples that map to evidence:
- http contains “hack” — hunt suspicious requests.
- dns.flags.response == 1 and dns.count.answers > 5 — spot high-answer responses.
- http.response.code in {200 301 302 404} — filter useful response codes fast.
Avoid logic traps
Multi-value fields need explicit patterns. Prefer dns.a && !(dns.a == 192.168.1.1) over dns.a != 192.168.1.1. That avoids dropping records with multiple answers.
Tip: right-click a field in the Packet Details pane and choose “Apply as Filter” or “Prepare a Filter.” Start broad, then chain conditions until you reach the exact packets and details you need.
Profiles, Color Rules, and Custom Columns for Faster Triage
Set up distinct profiles and color rules so each investigation loads the exact columns, colors, and layout you need. This keeps workflows repeatable and reduces errors during live traffic work.
Create profiles via Edit > Configuration Profiles. Save one profile per task: malware triage, exfiltration hunts, RDP sessions, and protocol debugging.
How to build and switch profiles
- Add columns: frame.number, ip.src, ip.dst, tcp.stream, http.request.method, http.host, http.request.uri, dns.qry.name, tcp.len. These make high-signal fields visible in the packet list view.
- Color rules: highlight HTTP POSTs, large tcp.len values, and NXDOMAIN bursts so risky traffic pops out without deep filtering.
- Switching: pick Edit > Configuration Profiles and select the profile for the current task. Each profile loads layout, colors, and saved filters instantly.
Team tips: version and share profiles for consistency. On small screens, hide low-value columns and keep tcp.stream and http.host visible. Use display filters sparingly and follow these practical tips when you need fast, reliable views of critical packets and data.
Following Streams: Reassembling Conversations in TCP, UDP, TLS, and HTTP
Follow Stream turns scattered segments into one readable conversation so you can read requests and responses as a single timeline. It reconstructs bidirectional flows and makes intent clear during fast triage.
Choose the stream type based on transport and goals. TCP reassembles ordered segments and shows retransmits. Use it when you need an exact view of request/response pairs.
UDP follow is best for simple, stateless exchanges where reassembly is minimal. TLS and HTTP options help when content is layered or when text is the main evidence.
Use the dropdown to scope the view to client-only or server-only. That reduces noise when one side floods the capture. Look for credentials, commands, or exfil markers in ASCII-based protocols and inspect binary blobs when needed.
Encrypted sessions: without keys the payload stays opaque. Still, metadata such as SNI, JA3 fingerprints, ALPN, and timing can reveal useful patterns.
Bookmark tcp.stream indices and use color rules and custom columns with those indices. That lets you pivot back to high-value flows quickly during detailed review.
| Stream Type | When to Use | What to Look For |
|---|---|---|
| TCP Stream | Ordered request/response tracing | Retransmits, sequence gaps, full payload |
| UDP Stream | Stateless exchanges like DNS | Query/response pairs, truncation |
| TLS Stream | Encrypted sessions | SNI, JA3, cipher suite, timing |
| HTTP Stream | Text-based web requests | Headers, methods, URIs, response codes |
Decode As and Protocol Analysis for Non-Standard Ports
Use Decode As when auto-detection misses a protocol on an unexpected port. Forcing the right dissector exposes application fields so filters, streams, and exports work correctly.
Auto-detection can fail when traffic uses high-numbered ports, and that hides useful application fields from view.
When the tool treats a flow as raw bytes, right-click the packet, choose Decode As, and select the correct protocol. For example, force a high-numbered port such as 9999 to decode as HTTP. That change reveals headers, URIs, and methods that were previously hidden.
This makes downstream tasks work: statistics will show proper protocol counts, Follow Stream reconstructs readable conversations, and Export Objects can extract files or text reliably.
Before you force a decode, verify payload heuristics—look for HTTP verbs or typical header strings. Forcing the wrong dissector can mislabel unrelated packets and skew results.
After applying Decode As, revisit saved filters and profiles so the newly exposed fields become part of repeatable workflows and captures.
From Packets to Insight: Statistics, IO Graphs, and Protocol Hierarchy
Protocol breakdowns and graphs expose hidden spikes and steady trends you might miss in lists. These views turn raw data into actionable signals for faster incident response.
Protocol Hierarchy quantifies where bandwidth goes and surfaces unexpected mixes of protocols. Use it when you need to spot sudden increases in specific layers or an unusual protocol dominating links.
IO Graphs visualize throughput, retransmissions, and custom field counts over time. Plot TCP retransmits per second or HTTP bytes to correlate performance dips with specific flows. This helps reveal traffic patterns and bursts you can cross-check.
Next steps from these views:
- Refine display filters and zoom into narrow time windows for deep inspection.
- Isolate streams responsible for anomalies and validate findings against raw packets.
- Save graph presets for common KPIs, such as retransmissions or error rates, to standardize team reviews.
| Feature | Useful for | What it reveals |
|---|---|---|
| Protocol Hierarchy | Resource mix | Unexpected protocol spikes |
| IO Graphs | Temporal trends | Throughput, errors, bursts |
| Saved Presets | Repeatable checks | Consistent KPI tracking |
Exporting Objects and Saving Captures for Collaboration
Saving captures right preserves evidence and speeds team review. Exporting objects recovers real files from flows and keeps findings reproducible.
Saving captured traffic with consistent naming and hashing protects chain-of-custody. Use pcapng for richer metadata and include creator notes in file comments.
Use File > Export Objects to recover files transferred over HTTP or SMB. Those artifacts support malware triage and incident evidence. When you export, log the time window and the exact display filter used so peers can reproduce results.
For long monitoring, set ring buffers, file size limits, and rollover counts. This practice prevents disk exhaustion while keeping the critical analysis window intact.
- Share package: include the capture file, applied display filter, time range, and short notes.
- Protect data: hash files, restrict storage, and sanitize sensitive payloads before external sharing.
- Rotation: rotate files hourly or by size on busy links to balance retention and resource use.
| Action | Why it matters | Tip |
|---|---|---|
| Export Objects | Recover artifacts for forensics | Save original and extracted files |
| Save as pcapng | Preserve interface and comments | Include hash and creator |
| Attach filters & notes | Reproducible collaboration | Bundle with timeline markers |
Handling Encrypted Traffic: Decryption Options and Safe Practices
Decrypting sessions can be possible when session keys or credentials are available, yet legal and policy limits must guide every step. When decryption is off the table, metadata and timing still support solid investigative leads.
Not every capture can be decrypted, but TLS sessions can yield plaintext when you supply session keys or server private keys. WPA2 can be recovered with the correct passphrase and handshake. Follow policy and chain-of-custody before using keys.
When payloads remain opaque, use SNI, certificate subjects, JA3 fingerprints, ALPN, and timing patterns for context. These markers help map suspicious flows and correlate with endpoint logs or IDS events.
- Safe practice: never enable external name resolution during sensitive work; use captured dns results instead.
- Common issues: missing keys, ephemeral ciphers, and TLS 1.3 can block decryption.
- Alternatives: collect endpoint logs, application logs, or server-side captures when decryption fails.
“Document every decryption step and protect keys — evidence integrity and security depend on it.”
| Action | Why | Tip |
|---|---|---|
| Use session keys | Enable TLS plaintext | Log key provenance |
| Rely on metadata | Preserve context without payload | Capture SNI and JA3 |
| Avoid external lookups | Reduce operational risk | Use captured dns |
Network Troubleshooting Playbook with Wireshark
Start troubleshooting by confirming link-level reachability and basic routing before digging into higher-layer symptoms. These quick checks often split network issues from server or app problems.
- Verify L2/L3 reachability: confirm MAC, ARP, and IP hops so frames move across the expected path.
- Confirm TCP handshakes: look for SYN → SYN‑ACK → ACK sequences. Missing or delayed handshakes point at drops or middlebox resets.
- Quantify retransmits: check for retransmissions and duplicate ACKs to separate congestion from server slowdowns.
Time DNS queries and responses. Slow or failed name resolution can masquerade as app slowness. Use time delta between dns.qry.name and dns.flags.response to spot latency.
Isolate noisy bursts with targeted filters and short time windows. Use IO Graphs to correlate spikes with DoS symptoms and then focus on the affected streams. Capture short samples on the troubled segment and compare them with baseline captures from healthy periods.
Inspect application headers: check for bad redirects, stale caches, or malformed fields that propagate user-facing problems. Correlate header errors with timing and retransmit counts to reach firm conclusions.
| Check | Why | Quick filter |
|---|---|---|
| L2/L3 | Confirm reachability | arp || icmp |
| TCP handshake | Detect drops | tcp.flags.syn && !tcp.flags.ack |
| Retransmits | Measure congestion | tcp.analysis.retransmission |
| DNS timing | Find resolution delays | dns && frame.time_delta |
Final tip: keep captures focused, document filters used, and preserve baseline data. This method speeds valid findings and keeps investigative data useful for later review and compliance.
Security and Incident Response Use Cases with Wireshark
Network traces often hold the timeline and proof you need during security incidents. This section shows practical use cases for detecting anomalies, suspicious domains, and data exfiltration using targeted traffic inspection.
Detecting anomalies and exfiltration
Watch for unusual destinations, sustained large transfers, or repeated flows to unknown domains. Correlate bytes transferred with session length and check HTTP headers for odd user agents or cookie patterns using regex.
Use simple filters like dns.count.answers > 5 and scoped http response sets to surface suspicious behavior fast.
Pivoting from DNS heuristics into streams
DNS reveals infrastructure. Flag high-answer responses, then follow related TLS or http streams for file transfers or command-and-control indicators.
Follow streams, export objects, and extract artifacts for deeper forensics.
Building reproducible evidence
Record timestamps, headers, and payload fragments packet-by-packet so findings are verifiable. Note the exact display filter, tcp.stream indices, and time window used.
- Document hypotheses: list filters and why you ran them.
- Preserve originals: work on copies and hash files.
- Collaborate: share stream indices and exported objects with IR teams for joint validation.
| Action | Why | Tip |
|---|---|---|
| DNS heuristics | Find suspicious infra | dns.count.answers > 5 |
| Follow stream | Reconstruct transfer | Export objects for proof |
| Document filters | Reproducibility | Save display filter and indices |
For curated examples and step-by-step security use cases, see this security use cases walkthrough.
A Professional’s Guide to Mastering Wireshark Packet Analysis
Begin with a clear question, then limit scope so investigation time stays focused. Work in small, repeatable steps: hypothesis, baseline, targeted filters, and verified conclusions.
Begin with a focused hypothesis: what symptom, which hosts, and which timeframe matter most?
Step-by-step workflow from capture to conclusions
Define the question and set the capture or dataset window. Establish baselines for normal network behavior.
Form hypotheses and iterate: index large files with display filters, then carve time windows for focused review.
Validate findings by following streams and checking packet details before you draw conclusions.
Tips for scalable analysis on large PCAPs
- Use IO Graphs to spot bursts, then slice time ranges for deep dives.
- Apply Decode As when ports hide application fields and follow streams for full conversations.
- Stage filters: narrow, export subsets, and process pieces so systems are not overwhelmed.
- Save profiles with consistent columns and color rules for reproducible triage.
| Step | Why it helps | Quick action |
|---|---|---|
| Index & filter | Find high-signal hosts | Use display filters, tag tcp.stream |
| Slice by time | Reduce noise | Cut windows from IO Graph peaks |
| Follow streams | Reassemble conversations | Export objects, inspect packet details |
| Archive results | Shareable evidence | Save pcapng, include notes and hashes |
Close the loop: translate packet findings into concrete, prioritized actions stakeholders can implement and track. This ensures data-driven outcomes and reduces repeat incidents.
Best Practices, Limitations, and Ethical Considerations
Before you press record, set tight goals and legal clearance for any network capture. Capture with purpose, limit scope, and treat stored data as sensitive evidence.
Ethical capture means obtaining permission, documenting the authorized window, and excluding unrelated hosts. Use least-privileged accounts and strong access controls so captured data stays protected.
Be blunt about limitations. The tool can be resource‑intensive on busy links. Encrypted payloads remain opaque without keys, and correct interpretation needs protocol familiarity.
Apply simple guardrails: disable external DNS resolvers in the UI, keep clear audit logs of display filters and timestamps, and store captures with hashes and retention policies. Update the software often so dissectors match modern protocols.
Pairing strategy: combine packet captures with flow telemetry and host logs. When field captures are constrained, reproduce cases in a lab for deeper inspection.
| Priority | Action | Why |
|---|---|---|
| Ethics | Get permission, limit scope | Protect privacy and legal standing |
| Guardrails | Least-privilege accounts, no external lookups | Reduce leaks and bias |
| Continuity | Follow release notes, update dissectors | Keep results accurate for new protocols |
Conclusion
Finish investigations by linking traffic patterns and packet details into reproducible decisions.Master the three panes, save profiles, and use display filters, statistics, and exports so raw data becomes clear evidence.
Wireshark remains the gold standard for packet-level visibility across major OSes; use wireshark deliberately and document each step.
Recap: mastering display, filters, statistics, and exports turns packets and traffic into actions that fix outages and strengthen defenses.
Try these common use cases: network performance triage, suspicious domain hunts, and validating application behavior before and after changes. Save profiles, iterate filters, and correlate traffic patterns with packet details so results stay repeatable and defensible at scale.
Practical nudge: keep skills current, share profiles with your team, and standardize workflows for faster, repeatable outcomes.
