
Surprising fact: Mirai-style networks have produced floods over 600 Gbps and claims of 1 Tbps, enough to drown many defenses in minutes.
We set the scene for a real-world case: how compromised IoT devices using default credentials coordinated traffic that pushed our website offline. This is a concise, practical botnet attack story that maps data signals to decisions.
Expect a minute-by-minute chronology showing network floods, application-layer hits, and state exhaustion. We pair latency, error codes, SYN backlogs, and DNS timeouts with the controls we engaged.
This study is for security leaders and operators who need clear, usable information under pressure. We name key terms like DDoS and explain why a modern cyber threat can pivot across layers.
Key Takeaways
- Modern botnets grow by exploiting default credentials on IoT devices.
- High-volume floods can hit 600+ Gbps and overwhelm unprepared infrastructure.
- Minute-level signals (latency, errors, SYN queue) guide fast mitigation decisions.
- Layered defenses reduce blast radius but some residual risk often remains.
- This report blends board-level impact with hands-on response steps.
- Practical playbook changes are summarized to harden the website for next time.
Setting the stage: our environment, traffic baselines, and risk profile before the attack
We kept tight, hour-by-hour visibility on content requests and network egress so anomalies stood out fast.Our runbooks and KPIs focused on time-to-detect and time-to-mitigate.
We maintained clear daily and weekly patterns for devices requesting our web content. That made small deviations visible within minutes.
Edge topology combined a CDN, Anycast DNS, and a WAF tuned for balance between protection and user experience. We labeled production systems by criticality to prioritize service actions.
We tracked device mix across platforms and geographies. This helped us understand latency profiles and decide when to scale or enable rate limits.
| Metric | Normal | Escalation Threshold |
|---|---|---|
| Requests per second | 1,200–1,800 | 5,000 |
| Concurrent connections | 4,000 | 12,000 |
| Error rate (5xx) | 5% |
IoT devices with default credentials were treated as probable sources of volumetric ddos. We pre-provisioned rate limits on sensitive endpoints and validated WAF rules continually to keep security measurable and effective.
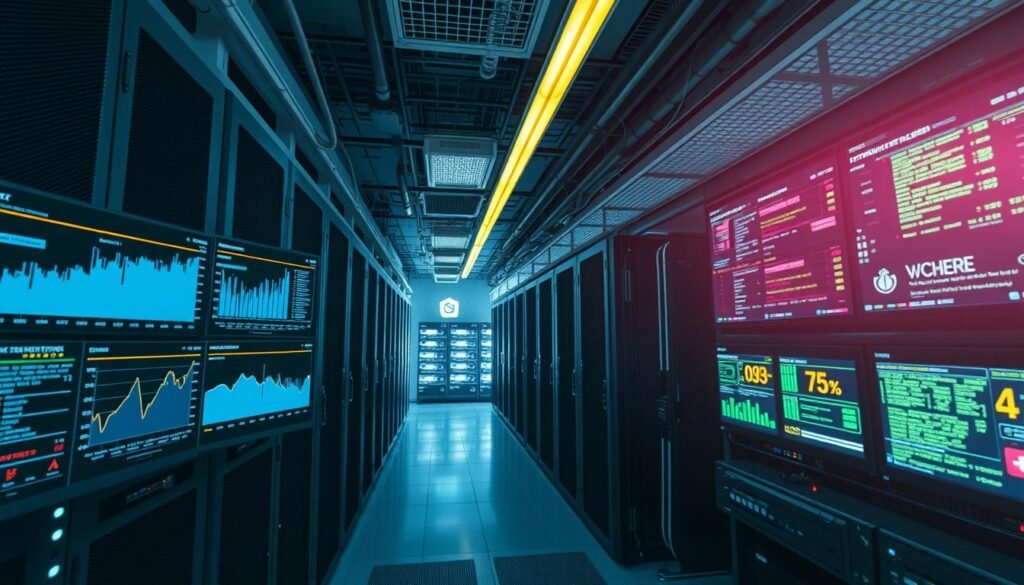
Minute-by-minute botnet attack story: what we saw as our website went dark
In a tight, real‑time window we saw sources multiply, state flags climb, and latency spike—forcing rapid choices to protect users and preserve forensics. This is a compact minute-by-minute account of signals and actions.

T‑00:05 — Early anomalies in request rate and geolocation spread
Unique IP counts rose quickly from unusual regions. The HEAD/GET ratio shifted, an early sign of coordinated probing against our website.
T‑00:00 — Traffic spike crosses auto‑scaling thresholds, latency surges
Autoscaling triggered but median latency tripled. Tail latency ballooned, revealing the first capacity cliffs for critical services.
T+00:03 — SYN backlog exhaustion and intermittent 503s on key services
SYN queue warnings appeared and authentication endpoints returned intermittent 503 Service Unavailable. State exhaustion at the edge became visible.
T+00:07 — CDN shields absorb bursts; origin saturation begins
The CDN deflected many requests, yet origin CPU and connection pools neared saturation. This indicated combined network and application pressure.
T+00:12 — DNS query timeouts mimic Dyn‑style resolution pressure
User traces and synthetic tests showed rising DNS timeouts. This mirrored past ddos events where recursive resolvers became a bottleneck.
T+00:18 — Application‑layer HTTP floods slip past basic WAF rules
GET/POST floods hit dynamic content paths and bypassed simple heuristics. We tightened rules and added targeted cache keys for hot content.
T+00:27 — Incident command established; rate‑limit and ACL changes deployed
We stood up incident command, applied per‑IP and per‑ASN rate limits, and pushed ACLs to block abusive signatures while watching false positives.
T+00:41 — Regional blocks and challenge pages cut load but impact UX
Regional blocks and CAPTCHAs reduced load. We chose measured friction to keep essential service while protecting users.
T+01:05 — Upstream provider blackhole routing and partial recovery
Upstream blackholing removed the largest flows and enabled partial recovery of core service endpoints.
T+01:37 — Attack tails off; logs stabilized for forensic capture
Traffic decayed. We captured packet samples, preserved WAF traces, and began time‑correlating layers for post‑event analysis.
Quick summary: We observed a rapid increase in distributed sources and request concurrency, exhausted SYN backlogs, then faced DNS and application pressure. Progressive mitigations restored partial service while preserving forensic visibility.
What our forensics revealed about the botnet and infected devices
Evidence from captures, credentials telemetry, and DNS beacons painted a consistent picture of compromised home devices. The data guided immediate containment steps and longer-term hardening priorities.
Were weak passwords and consumer stacks the main sign?
Yes. Traffic fingerprints matched patterns typical of consumer internet things: repeated login failures, simple TCP stacks, and low-entropy user agents.
Credential bursts aligned with default password spraying against exposed services. That telemetry pointed to many vulnerable iot devices in the wild.
What kinds of devices did we see?
Source IPs clustered in consumer ASNs. Host signatures suggested home routers, cameras, and DVRs rather than servers.
Packet timing and retransmit behavior supported that interpretation and explained steady, sustained pressure instead of a single spike.
How did command-and-control behave?
We observed synchronized DNS lookups to ephemeral domains at regular intervals, a hallmark of coordinated C2 beacons. That pattern helped confirm coordination without over‑attributing to a single family.
What did the evidence show? Traffic and port behavior matched IoT-origin patterns: weak passwords, consumer-grade TCP stacks, and periodic DNS beacons to command-and-control.
For context on methods and mitigation, see our primer on common types of cyber attacks.
How the distributed denial-of service unfolded across layers
We observed the disruption cascading through network, transport, and application layers within minutes. This combined campaign included volumetric floods, targeted HTTP surges, and SYN-based state exhaustion that degraded services despite CDN shielding.
Volumetric barrages: UDP floods and TCP options
High-volume UDP reflection and direct UDP floods saturated transit links first. Transit saturation stressed edge routers and forced upstream filtering.
Mirai‑style modules used multiple TCP flooding options as well. Limited TCP option variance hinted at homogeneous firmware on many iot devices, which helped us create precise filters without impacting legitimate traffic.
Application pressure: HTTP GET/POST floods against dynamic content
Application-layer traffic targeted dynamic endpoints with GET and POST patterns that bypassed naive caching. Each request increased CPU and database load.
We instrumented per-endpoint metrics to spot hot paths and deploy targeted cache keys and WAF rules. Rate-based autoscaling bought time but could not fix upstream saturation alone.
State exhaustion: SYN floods overwhelming connection tables
SYN floods filled connection tables and exhausted SYN backlogs at the edge. That caused resets and intermittent service unavailability for legitimate users.
Coordinated responses—upstream scrubbing, per‑IP limits, and ACLs—were required to restore baseline service. The botnet rotated vectors to bypass single-layer mitigations, proving layered defenses are essential.

Bottom line: Multi-vector ddos demands concurrent controls across network, transport, and application layers. Instrumentation and upstream collaboration are critical to withstand peak phases of service attacks.
Mirai context and parallels from 2016 that informed our response
Mirai’s scale and code release rewired defender playbooks. The 2016 campaigns showed how quickly default credentials can seed hundreds of thousands of compromised devices and create sustained pressure on services. We used those lessons to shape detection, escalation, and upstream engagement during our incident.
Why Mirai matters: Mirai grew fast by scanning for weak logins and chaining simple TCP stacks into coordinated floods. Public incidents set practical limits for what upstream scrubbing and coarse filters can absorb.

Default credentials at scale: Mirai’s rapid growth
Mirai became active in August 2016 and rapidly infected hundreds of thousands of devices. That replication via default passwords proved a durable threat model: many consumer routers, cameras, and DVRs were easy targets.
Record benchmarks: Brian Krebs and OVH
The 623 Gbps flood against Brian Krebs and the OVH campaign reportedly nearing 1 Tbps set new planning thresholds. We treated those numbers as worst‑case ceilings when sizing scrubbing and upstream options.
Dyn, Minecraft servers, and collateral outages
The Dyn incident showed how hitting DNS infrastructure can ripple across many websites. Reports tied disruptions to gaming targets, including Minecraft servers, illustrating how non-enterprise motives can still break major services.
Source code leaks, copycats, and router exploits
The public release of the Mirai source code spawned many variants and booter offerings. A notable variant exploited CWMP and contributed to Deutsche Telekom router outages, underscoring that version-specific weaknesses at the edge can amplify traffic.
Bottom line: Historical Mirai-era incidents—scale, public source code, and device vulnerabilities—directly informed our detection thresholds, WAF tuning, and when to escalate to coarse, region-based filters.
Attribution, or why pinning a precise botnet family is hard
Short answer: public source code and shared modules make definitive naming unreliable. We prioritized clear mitigation steps over speculative labels and used confidence‑based language in reports.
Can we name the family?
Can we name the family? With the Mirai source code public and multiple independent clusters operating, a single label rarely fits the telemetry we saw.
Overlap of techniques across variants and clusters
Tool reuse lets separate operators field near‑identical instances that differ only by infrastructure or minor signatures.
Protocol choices—HTTP, UDP, and TCP—often overlap. That makes distinct attacks look the same in aggregate logs.
- Shared IOCs: We found artifacts tied to known families, but those alone did not prove ownership.
- Confidence-based reports: We stated observed facts and separated hypotheses from conclusions.
- Operational focus: We tuned controls and tracked evolution rather than anchoring defenses to a name.
Attribution mistakes can misdirect defenses. We preferred actionable information for partners and anonymized indicators for sharing.
Our layered mitigation: what worked, what failed, and what we changed
We used concurrent controls across the network and application layers to protect service availability, then hardened identity and provider choices to reduce future risk.
Which defenses mattered? Upstream filtering and selective blackholing reduced peak load. At the application layer, adaptive WAF rules, challenge pages, and cache tuning stabilized critical services while we hardened identity hygiene and provider choices.
Network controls: We coordinated with transit providers for targeted rate limiting and filters. When flow volumes threatened shared infrastructure, upstream blackhole routing shed the largest traffic bursts and preserved reachability for core service endpoints.
Application defenses: We tightened WAF signatures to block abusive patterns and rolled out per-endpoint challenge pages (CAPTCHA) for suspicious sessions. We also applied aggressive caching and surrogate keys for expensive dynamic paths and served stale content when backends were stressed.
Identity hygiene and endpoints: We audited exposed admin panels, removed default passwords, and enforced login rate limits on authentication APIs. We pushed guidance for automatic patching and recommended security software for edge devices to reduce the pool of infected devices and vulnerable iot devices.
Provider choices and playbooks: We validated resilient DNS with Anycast, rehearsed CDN failovers, and contracted scrubbing services. Playbooks now specify when to deploy regional blocks, when to enable challenge flows, and when temporary degradation is acceptable for noncritical services.
Example: pre-staged challenge flows that trigger only above defined thresholds have reduced collateral UX impact while giving us a rapid throttle option in future incidents.
Broader ecosystem lessons for websites and services facing DDoS attacks
Cheap DDoS-for-hire platforms and plentiful vulnerable devices make service disruptions a recurring risk for web operators. Plan for repeat incidents, not one-off events. Focus on coordination with providers and clear user communication.
What drives these incidents?
Threat economics: booter services and gaming motivations
Cheap rental services and gaming rivalries fuel many ddos attacks. Low-cost access and plentiful internet things let opportunistic actors hit modest targets or cause collateral damage to adjacent services.
- The economics favor offenders: low cost, high scale, easy reuse of iot devices.
- Spillover risk: gaming servers often draw concentrated hits that ripple across shared upstream links.
- Infrastructure churn: operators rotate infrastructure, hampering takedown and attribution.
- Defender playbook: shared intel, upstream partnerships, and community blocklists reduce risk more than isolated actions.
| Risk Factor | Why it matters | Practical step |
|---|---|---|
| Cheap booter services | Lower barrier to launch ddos attacks | Contract scrubbing and monitor for repeated patterns |
| Vulnerable iot devices | Large, persistent pool of compromised hosts | Promote device hygiene and vendor disclosure |
| Shared upstream links | Collateral outages across services | Segment traffic and pre-negotiate upstream filters |
Quick guidance: Invest in layered defenses and routable scrubbing. Rehearse incident response and keep public status pages clear to reduce confusion during adjacent outages.
Business impact and communications timeline
During the incident we ran a tight cadence of public and internal updates to link technical progress with business outcomes. We prioritized clarity so customers and partners could make informed decisions while the service recovered.
How did we communicate?
We issued time-stamped updates on our status page, synchronized stakeholder briefings, and published a transparent post-incident study once logs were fully analyzed.
Who got updates and what they said
We aligned executives, support teams, and engineers on a single source of truth. That reduced conflicting guidance and sped decisions.
Public notes spelled out differences between upstream provider issues and our own website or service constraints. This cut down speculation and helped media coverage stay accurate.
- Periodic internal situation reports tracked mitigation time, residual risk, and next steps.
- Customer messages included safe workarounds for critical workflows during partial restoration.
- We kept detailed timelines for compliance and insurance, mapping traffic intensity to availability metrics.
After stabilization: we published a structured summary of what happened, what we changed, and how we will reduce time to mitigation in future events.
Quick note: Lessons learned fed incident drills and training so teams can act faster and communicate clearer on the next ddos or related event.
Conclusion
We turned noisy signals into prioritized steps that reduced downtime and preserved forensic value. This short summary captures operational lessons, hardening priorities, and practical examples you can apply to protect your website and core services.
Key takeaways: monitor for early anomalies, assume multi‑vector pressure, and coordinate network and application controls quickly.
Hardening matters: remove default passwords on home and office devices, pre-stage challenge flows and cache strategies for expensive paths, and contract upstream scrubbing for ddos resilience.
Expect compromised internet things to persist. Invest in observability that supports fast detection, clear communication with customers, and playbooks that handle reused source code and evolving variants of botnets.
FAQ
What immediate signs indicated our website was under a distributed denial-of-service incident?
The first signs were a sudden surge in requests well above normal baselines, widespread source geolocation dispersion, rapid spike in TCP connection attempts, and early SYN queue exhaustion. Latency rose sharply and health checks began failing before full service degradation occurred.
How did auto-scaling and CDNs respond during the first minutes?
Auto-scaling triggered additional compute instances but could not keep up with connection and state exhaustion. The CDN absorbed short bursts and cached static content, but origin saturation and prolonged SYN/connection floods caused upstream timeouts and increased origin error rates.
What network-layer behaviors did we observe that suggested state-exhaustion rather than just volume?
We saw long SYN backlog queues, repeated incomplete TCP handshakes, and rapid exhaustion of connection table capacity on load balancers and firewalls. These signs point to state-exhaustion techniques rather than only volumetric UDP floods.
Which application-layer patterns slipped past basic WAF rules?
Low-and-slow HTTP GET/POST floods targeting dynamic pages, highly varied user-agent and header fingerprints, and legitimate-looking session sequences made filtering by simple rule sets ineffective. The requests mimicked real user behavior enough to evade thresholded WAF rules.
What forensic indicators linked the traffic to compromised IoT devices?
Signatures included scanning for open Telnet/SSH ports, login attempts using default credentials, common device user-agents, and consistent command-and-control DNS query intervals. Source IP diversity and ASN distribution matched home routers, security cameras, and DVRs.
How did Mirai’s history influence our triage and mitigation choices?
Mirai’s 2016 campaigns demonstrated how default credentials and exposed IoT services scale rapidly. Knowledge of Mirai’s use of simple credential stuffing and its public source code led us to prioritize rapid credential resets on edge devices, aggressive upstream filtering, and engagement with ISPs for sinkholing malicious prefixes.
Why is precise attribution of a distributed campaign so difficult?
Multiple malware families share toolsets, payloads and reuse open-source components. Shared command servers, hijacked cloud resources, and false-flag techniques blur attribution. Overlapping tactics, techniques, and procedures (TTPs) across variants hinder confident family identification.
Which layered defenses proved most effective in restoring service?
A combination of upstream rate-limiting and blackholing, anycast CDN failover, adaptive WAF rules with challenge pages, and ISP scrubbing reduced load fastest. These network and application controls together reduced origin load while preserving critical user traffic.
What failed or needed improvement in our incident response?
Initial reliance on static WAF rules was insufficient. Auto-scale delays and improper connection-tracking tuning caused slow recovery. Post-incident we improved SYN backlog tuning, automated ACL deployment, and runbooks for faster provider coordination.
How should organizations harden exposed IoT devices to reduce future risk?
Eliminate default passwords, disable unused management interfaces (Telnet, insecure UPnP), apply firmware updates, segment IoT on a separate VLAN, and enable device-level logging. Where possible, enforce strong credential policies and automated patching from device manufacturers.
What role do booter services and game-server disputes play in these incidents?
Booter or stress services monetize access to compromised devices and are frequently used to disrupt game servers or settle disputes. These services lower the barrier to launching high-volume campaigns, increasing the frequency of incidents against small and large targets alike.
How can small businesses prepare cost-effectively for large-scale service interruptions?
Prioritize resilient DNS providers, anycast CDNs, and clear runbooks for emergency DNS and traffic steering. Implement baseline rate limits, maintain incident contact lists for ISPs and scrubbing partners, and practice tabletop exercises to reduce reaction time and mistakes during real incidents.
What logging and forensic steps are essential during and after the event?
Preserve packet captures at edge points, archive web and system logs with synchronized timestamps, capture firewall and IDS alerts, and snapshot affected VMs for analysis. Early log stabilization enables pattern extraction and supports communication with upstream providers and law enforcement.
When should we involve upstream providers or a DDoS scrubbing service?
Engage providers as soon as traffic exceeds your network or application capacity or when mitigation affects legitimate users. If in-house controls cannot restore service within minutes, enlist a scrubbing partner or ISP filtering to reroute and cleanse traffic at scale.
Are there industry references and advisories that can guide post-incident fixes?
Yes. Consult vendor security advisories, CVE entries for affected devices, and authoritative analyses such as Brian Krebs’ reporting and CERT/CSIRT bulletins. These sources help prioritize patches and track known exploitation patterns tied to IoT exploits and Mirai-style malware.
How should organizations communicate with customers during prolonged outages?
Provide regular, concise updates via a status page and social channels, state visible actions taken, and set realistic recovery timelines. Transparency builds trust—share what’s known, what’s being done, and when customers can expect the next update.
